- The Ops Digest
- Posts
- 💡 What Your Order History Is Trying to Tell You
💡 What Your Order History Is Trying to Tell You
Unlocking customer service insights from order data you didn’t know you had.
Welcome to The Ops Digest!
AI-powered order management is transforming manufacturing and distribution. Each week, we bring you actionable insights on automation, efficiency, and best practices to streamline order processing and customer inquiries.
👉 BTW — there's a copy/paste AI prompt below you can run TODAY to unlock hidden trends in your ERP + support data.
Let’s go.
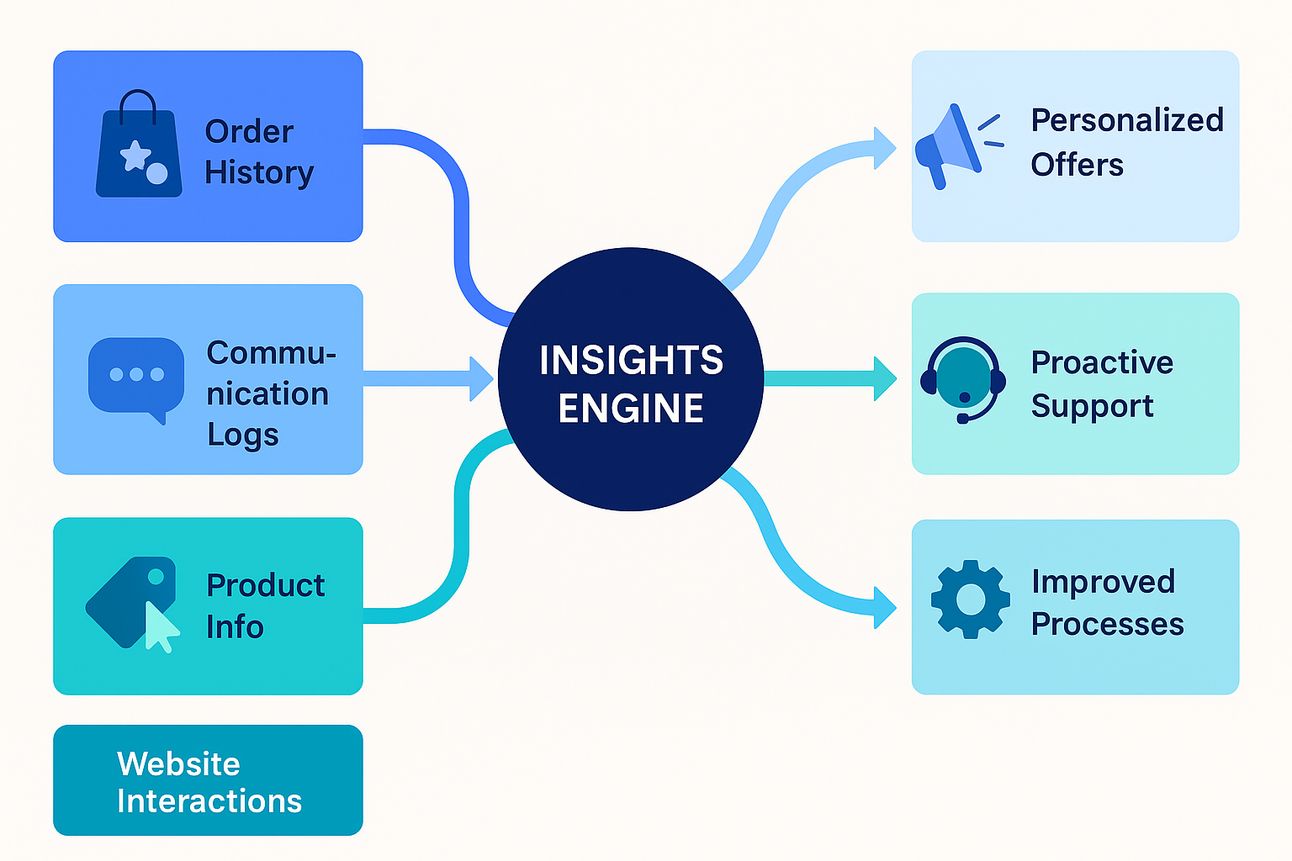
🧠 You’re Sitting on a Goldmine. You Just Don’t Know It Yet.

You ship hundreds (or thousands) of orders a week.
Every one of them leaves a trail: timestamps, SKUs, complaints, emails, returns.
And yet…
Most teams treat order data like a conveyor belt:
📥 Email → 📦 Fulfillment → 🧾 Invoice → 🗑️ Insight lost.
But your order data is more than logistics.
It’s customer behavior.
It’s product feedback.
It’s process intelligence.
The best ops teams? They turn order flow into customer intelligence.
And that changes everything.
🚩 What You’re Probably Missing:
Let’s play this out:
✅ What you log:
Order ID
Product
Quantity
Ship date
Status
❌ What you ignore:
This SKU has a 21% return rate… but only from two states
People who order X and Y together almost always file a ticket
That WISMO spike? Tied to one fulfillment center’s lag
You don’t need “more data.” You need smarter patterns.
Patterns that show you where ops issues are becoming CS problems.
🔁 What Smart Ops Teams Do Instead:
Here’s how your peers are using their own order data to fix what’s broken and prevent what’s coming.
1. 📦 Flag High-Risk SKUs
Map returns to SKU + shipping origin + packaging type
Track complaints tied to product usage, damage, or confusion
Identify repeat offenders—before they go out the door again
💥 Example: “SKU-1124 returns spiked 40% last month… only when it shipped from Warehouse B.”
💥 Example: “Model Z gets daily support requests asking if it fits the Z-Clip. It doesn’t. But we never say that.”
2. 🧠 Find Correlation, Not Just Volume
Forget “top sellers” or “most returned.”
Look for combinations that create chaos:
Bundles that confuse (“Do I need both?”)
Add-ons that don’t match the base SKU
SKUs that spike refund requests when sold under a promo
🧩 These aren’t bugs. They’re patterns. You just haven’t surfaced them yet.
3. 🔄 Close the Loop with CS Data
CS teams hold the keys to context.
But most of that context dies in Zendesk.
Bring it upstream.
→ Let ops see which products cause “not what I expected” complaints
→ Pipe support reason codes back into product and fulfillment teams
→ Use historical CS notes to preemptively rewrite bad descriptions or fix packaging flow
🤖 Make It Actionable: Run This AI Workflow
You don’t need a data scientist to find insights. You just need to connect your ERP and support data, and have AI help you.
🧾 Step-by-Step:
Export two CSVs
From your ERP: Order IDs, SKUs, ship date, warehouse, return reason
From your ticketing system: Ticket ID, order ID or SKU, reason code, timestamp, resolution
Upload the two reports as CSV files to ChatGPT (o3 version) or Claude (3.7 version)
Paste this prompt:
You are an operations analyst.
Dataset1 = order_returns.csv
Dataset2 = support_tickets.csv

1. Cluster by SKU + Warehouse.
2. Surface any SKU/warehouse pairs with ≥10% return rate AND ≥10 tickets.
3. List the top 5 overlapping reason codes.
4. Recommend three ops changes that would eliminate ≥25% of those tickets/returns.
Output as a markdown table plus bullet-point actions.
Ask for grouped takeaways:
Top SKUs causing support pain
Repeated issues tied to specific regions/warehouses
Suggested updates to fulfillment or product data
With full datasets, you’ll surface exactly the kind of SKU-, warehouse-, and workflow-level insights that drive double-digit drops in returns and support volume.
🏁 TL;DR: Your Orders Are Talking. Start Listening.
It’s fuel for:
✔️ Happier customers
✔️ Lower returns
✔️ Fewer tickets
✔️ Better margins
✔️ Saner ops
But only if you use it.
If your system can’t show you these patterns… maybe it’s time for one that can.